Tuesday, August 20, 2019

Mapping Peterloo

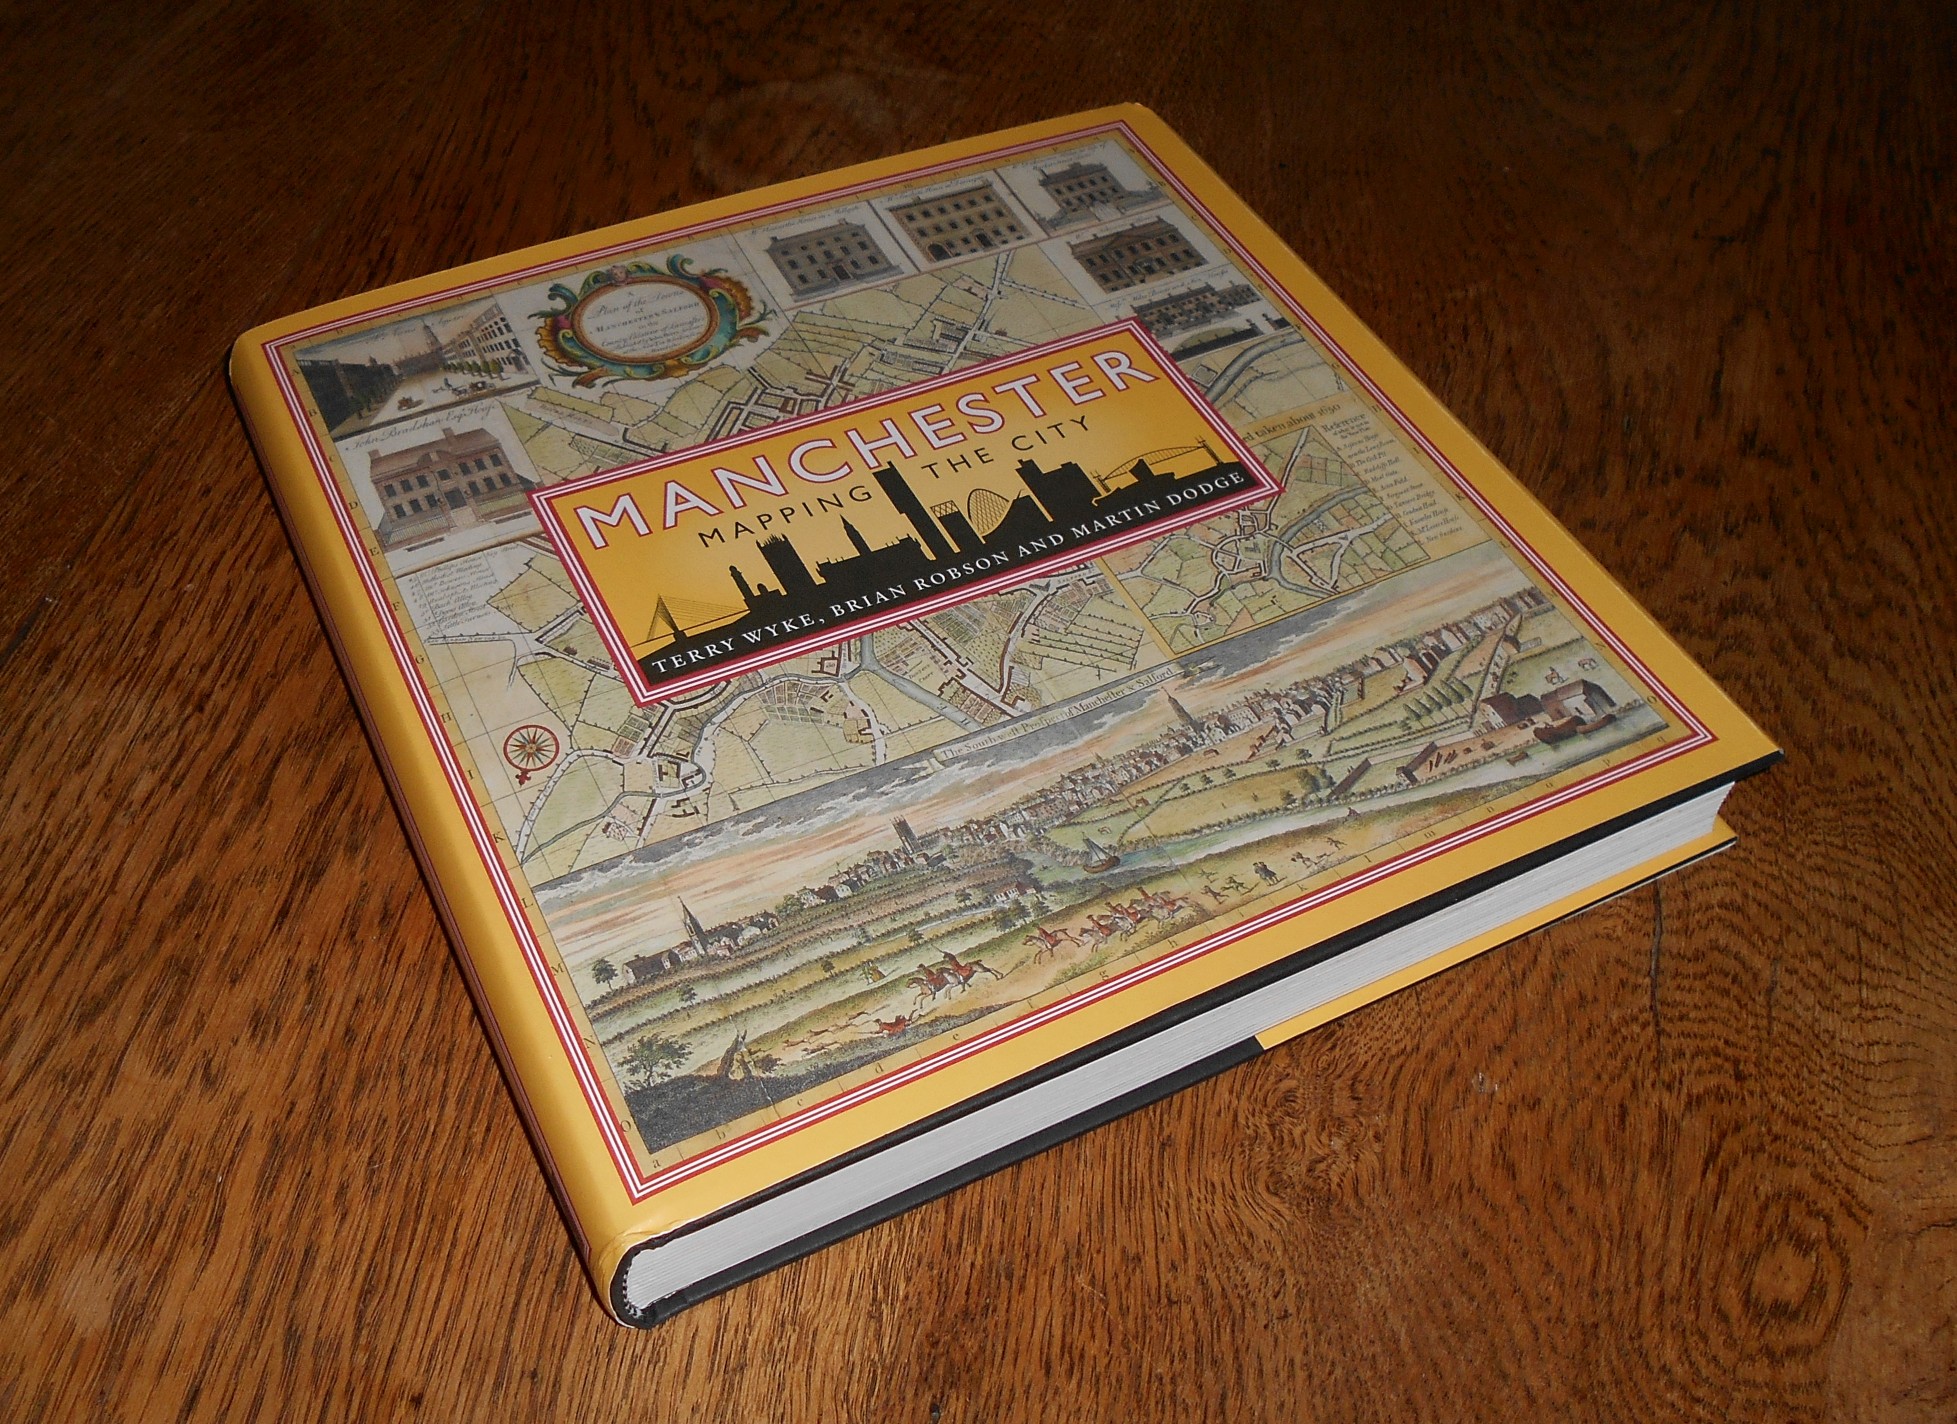
There is much commemoration of the Peterloo massacre in Manchester at the moment. One aspects of this event that I thought was interesting was the role of maps produced soon after to try explain visually what had occurred. Some were produced by supporters of the protests and other maps were used by the establishment to defend their action. We included a chapter on Peterloo and these maps in our book, Manchester: Mapping the City, which gives more detail.


Also, to give a little more background on the subject, my co-author Terry Wyke penned this short piece.

Peterloo. What is there to see?
Monday, 16 August 1819 was the date of one of the most important events in the history of political democracy in this country.  On that day a massive crowd met on St Peter's Field in Manchester to hear Henry ‘Orator’ Hunt demand fundamental political and economic reforms that would improve the lives of ordinary working people. Alarmed by the size of the crowd the magistrates ordered the arrest of Hunt and other speakers. What followed became known as the Peterloo Massacre. In their attempt to arrest Hunt the mounted troops of the Manchester and Salford Yeomanry Cavalry rode into the peaceful crowd with sabres drawn. As one eyewitness recalled: ‘In ten minutes from the commencement of the havock, the field was an open and almost deserted space. The Yeomanry had dismounted, – some were easing their horses' girths, others adjusting their accoutrements; and some were wiping their sabres. Several mounds of human being still remained where they had fallen, crushed down, and smothered’.

Conflicting accounts of exactly what did happen, the size of the crowd, the number of casualties, and who was responsible were soon circulating. Political reformers saw the decision to use the military as deliberate and planned; the authorities justified their actions arguing that the crowd threatened the very safety of the town. These opposing views were evident in the press reports, pamphlets and cartoons. They were also evident in the maps that were produced of St Peter’s Field. These maps were to be a vital source in the passionate arguments that followed Peterloo but have been less studied by historians.

The first to be published was by the reformers, which identified the disposition and movements of the different military forces as well as very specific including the location of the banners and caps of liberty which so infuriated the military. This was followed by a plan based on a survey conducted by the authorities. They were on different scales but both became vital evidence in the subsequent trials and inquests in which references abounded to the stationing and movement of troops in the streets around St Peter’s Field.

They provide a revealing view of an open space that no longer exists in the city centre. The open space of St Peter’s Field between Windmill street and Peter street took its name from the neighbouring St Peter’s church, the most prominent landmark in this part of Manchester but the maps also show that the crowd spread across Peter street as far as the Friends Meeting House. This was possible because in 1819 Peter street was still largely undeveloped. The maps identify the meeting house’s boundary wall in what was to become Bootle street. Ten feet three inches high according to the military it was to feature in the evidence given in court because people watched the events of Peterloo unfold from the top of it, events that included people being pushed against it as the crowd rushed to escape the mounted soldiers.

Today we usually associate the location of Peterloo as between Windmill street and Peter street is embedded in our history, an open space that disappeared as buildings including the Free Trade Hall and the Theatre Royal were erected. But as these maps indicate our understanding of the boundaries of that famous meeting have become vague. The open space stretched beyond Peter street, certainly as far as the Quaker meeting house. Walking along Bootle street one can still see the wall which is the only large structure directly associated with the massacre that has managed to survive. As preparations are put in hand to celebrate the bicentenary of Peterloo, arrangements should be made to fix a plaque on what might seem to be a rather unremarkable wall, hardly worth a second glance.

This is another contemporary Peterloo map that has recently been digitised by the John Rylands Library and can be browsed in detail.


Thursday, July 25, 2019

Burnage Garden Village

For the past few months I have been working on a small project looking at the early development of an Edwardian garden suburb in south Manchester. The impetus for the project came out of searching for a plan of this small housing estate back in summer of 2017 for inclusion in our Manchester: Mapping the City book.

The major goal was to produce a small exhibition celebrating the planning of the Burnage Garden Village and provide an explanation for the layout and house architecture, as well as some discussion of the social life for early residents. The exhibition was developed in collaboration with Alison Ronan, Vicky Jolley and Lois Smith.


The exhibition was displayed in Manchester Central Library from March to May 2019. 

The centre piece of the exhibition were two models showing the layout of the estate and the design of one of the houses. The custom-built models were the work of Jim Backhouse from the University of Manchester model-making workshop.

Two hundred copies of an small exhibition booklet were distributed, including a complimentary copy posted to all the residents on the Village. A version of the booklet can be downloaded for free.

The models and exhibition materials have been donated to Burnage Library.

Thanks to funding from School of Environment, Education and Development at the University of Manchester and to Manchester Geographical Society.

Sunday, October 21, 2018

New Book - Manchester: Mapping the City


Its a large format, full colour, coffee-table style book featuring a fascinating array of maps and plans showing how the city has grown and changed from 1753 to 2018.

More details on the book at, http://www.mappingmanchester.org


Tuesday, November 01, 2016

Mapping the Historical Geographies of Higher Education in Greater Manchester
Symposium flyer
I am co-organising a one-day symposium on the 9th November examining the histories and varied development of the universities and institutions of higher education across the Manchester and Salford region.

The speakers, in multiple different ways, focus on the interactions between place, planning and architectural design to create effective environments for higher learning and scholarly research. The flyer above has the programme of talks.

The symposium is interdisciplinary with speakers from history, geography, town planning, architecture, history of science, art history, and allied disciplines. Papers look at different time periods, theoretical positions and empirics of particular institutional histories.


The symposium is free to attend but please register.


Organisers: Martin Dodge (Geography, University of Manchester), James Hopkins (University of Manchester Historian and Heritage Manager), Richard Brook (Manchester School of Architecture).

Monday, August 29, 2016

In what ways might old maps be useful for contemporary urban scholarship?

MappingDeeply, Mapping the PastMy long-term interests in map artefacts and mapping practices seem to be stuck in the past these days! I have become, to an increasing degree, a historical geographer in terms of my research activities. Intellectually, I am engaged in thinking about the role and relevance of visual representations such as maps and map-like spatial materials from the past, within contemporary scholarship on cities, infrastructure and techno-social practice. 

In broad terms I am mapping out the value of historical cartography, and at the same time working to make more old map and 'technical' plans of infrastructure publicly available through digitisation.

I am trying to think about what we can glean that is distinctive from having free access to many old and original thematic maps, detailed topographic sheets, technical diagrams, engineering plans, historic aerial photographs and paper architectural drawings. Can the ready availability of increasing range and depth historical visual representations reveal unique aspects of the structure of cities not available from other sources?
Some of my current thoughts on the latent value locked up in historical cartography and other kinds of 'technical visualities' of the built environment, and how appropriate digitisation can help unlock access and lead potentially to new ways to understand space and place are discussed in a piece I recently wrote for Progress in Human Geography. Also related is my review essay for the journal Imago Mundi examining the publication of new monumental historical encyclopaedia, Cartography in the Twentieth Century.
Cartography in the Twentieth Century review essay
In practice my research on historical cartographies and technical visualities has been conducted in large part through conventional archival methodologies, involving considerable time working in various interesting archives and ‘technical’ collections in Manchester, such as those at the Museum of Science and Industry. To find particular old maps and original plans for infrastructure in Manchester I have also had to venture elsewhere, including the National Grid Gas Archives in Warrington, the GPO / BT telecommunications collection in central London and the National Archives at Kew. 
I have also been undertaking a number of digitation projects relating to historical cartography and technical visualities, usually in collaboration with specialists at the University of Manchester Library (UML). Most material digitised concerns aspects of Manchester’s urban geography, transport provision, town planning and infrastructural development during the nineteenth and twentieth century. 

Some of the key digitisation projects I've instigated in the last five years or so include scanning a set of old maps and original plans relating to the design of the Manchester Ship Canal, encouraging the capture of series of 60 different street directory maps for Manchester city centre from across the nineteenth century and in the early twentieth century (the originals are held by Manchester City Library and are available on their Flickr page or browseable via UML Luna service). I also initiated the digitisation of bomb damage maps from the Second World War, and put in a lot of work on the scanning and sharing of key official reports related to ‘fifty years of planning the future of Manchester’. All these digital resources, relating to aspects of Manchester's historical geography, are heavily used by different groups including members of the public and I receive a steady stream of enquiries about them.    
Plans and maps of the Manchester Waterworks 
Rather more niche pieces of digitisation that I have instigated relate to infrastructure in Manchester including the railway system and the water supply. The UML have digitised the 1844 ‘Plan and section of an intended railway, to be called the Manchester South Junction and Altrincham Railway’ and also J.F. Bateman’s massive book on the ‘History and Description of the Manchester Waterworks’ from 1884, which contains many fascinating engineering diagrams and some useful maps of system design. In collaboration with the Holy Name Church on Oxford Road, I have also digitised some of the key architectural drawings for this Grade I building. 

In relation to the history of the University of Manchester, I have served as academic lead on the Campus Maps Through Time project, making the selection of which original archival materials and important historical reports should be digitised.
Campus Maps Through Time
Some of the results of my archival research and digitisation work, which speak directly to the unfolding of urban space, were deployed in the recent public exhibition on 'Making Post-war Manchester' that I helped to co-curate with Richard Brook and the Modernist Society. You can see the range of visual material narrated in the exhibition catalogue, now available freely online.

Tuesday, July 12, 2016

Views over Central London from 68 Storeys High


I was in London the other week and took the opportunity to visit the 300 metre tall Shard skyscraper and do a trip up to the viewing decks on the 68th floor. I really like such high overlooks above city centres and this has long been missing in London with no publicly accessible high observation platforms.

I moved out of London over ten years ago, relocating to Manchester in 2005. Since then there have been so many new tall towers built in central London, including the 'Walkie-Talkie' in the 'Square Mile' itself but also spilling out to other parts as land values have spiralled upwards and the planning constraints have seemingly been relaxed around speculative skyscraper development. Looking out over London from the Shard you get a very visceral portrait of the raw power of capitalism to transform landscapes and the rapidity in time that change can be enacted. One gains also a sense of the significance of central places, evident in the prominence of iconic buildings and symbolic sites, and how they are so geographically clustered to maximise accessibility.


Another aspect of accessibility that struck me from the Shard's high perspective above London was how the surface railways, built in the second half of the nineteenth century, snake their way along the southern flank of the Thames to reach key train stations on the river. This transport materiality still in use today speaks clearly to the power of the Victorian era railway enterprise (and the skills of its civil engineers) to carve through this space, in what would have been a densely crowded city.

Lastly, the Shard viewing deck also had an interesting loo with a view! This reminded of a previous research fascination I had with the 'smallest room' and in particular the role of sensor technology in the automatic production of public toilets.


Wednesday, June 29, 2016


https://www.flickr.com/photos/44756255@N07/27882988075/in/album-72157669631778591/
Holy Name Church Digitisation Project

I have been working on a small but significant project to digitise and share some of the original architectural drawings and sketches for the Holy Name Church

The Church, which opened for worship in 1871, is an architectural icon on Oxford Road and is rightly a Grade 1 Listed building. But sadly I think it is also somewhat overlooked by busy scholars and students. Many people spend years at the University of Manchester - myself included - and pass by every day and never look inside nor consider its distinctive Gothic-inspired architectural design.

The architectural drawings shed new light on the design and the early history of the Holy Name including the unrealised plans for a tall lantern tower and spire.

There are more details on the project in this press release and you can browse all the digitalised images in this Flickr album. The enthusiastic support of the Church is gratefully acknowledged, including their willingness to release the images free online for wide public access.

The digital photography and scanning work on the delicate old drawings was expertly handled by Nick Scarle in the University's Cartographic Unit and logistical support was kindly provided by the SEED technicians in the Geography labs and the Architectural modelmaking workshop

https://www.flickr.com/photos/44756255@N07/sets/72157669631778591/

Thursday, June 09, 2016


Making Post-war Manchester exhibition
Our exhibition, Making Post-war Manchester is ongoing and is being well attended. It also seems be attracting some positive comments on the twitter-sphere.

Here are a couple of pixs of the exhibition installation, courtesy of co-curator Jack Hale at the Manchester Modernist Society.
Making Post-war Manchester
We also got a great feature for the exhibition in the Guardian newspapers on Monday. Journalst John Harris spent quite a while discussing the exhibition with us and did a good job at summarising some of our ideas in his 'Lost Horizons article'.
Guardian newspaper article by John Harris


Sunday, June 05, 2016

Making post-war Manchester: visions of an unmade city

Over the last few months I have been working on a exhibition about planned - but unrealised - urban changes in the 1960s for Manchester. Drawing upon a fascinating range of original sources, plans and architectural models we set out to consider how Manchester city centre could have been transformed if a number of large-scale commercial, educational and entertainment redevelopment schemes had come to pass. The exhibition emerged from an architectural studio project lead by Richard Brook with a talented group of Masters students, working in collaboration with Dr Kevin Tan (MMU computer science game design) and the Manchester Modernist Society.   

The outline pitch for the exhibition is as follows: "During the 1960s a vision of Manchester was being drawn up by property developers and town hall planners that only existed in architects drawings and consultant’s reports and was never realized in concrete and steel. Manchester was booming and vast swaths of the city centre were scheduled for redevelopment for entertainment, shopping, education, office complexes and transportation. But as with many masterplans, only portions of what was designed were actually built. In this exhibition, for the first time, visitors will be able to encounter the 'unmade city' - the masterplans as they were intended to be."

The exhibition opened last Friday and runs for the next three weeks. It has been installed in the glass-fronted foyer of the Manchester Technology Centre right on Oxford Road. This building was formerly known as the 'National Computing Centre' and is an interesting example of a 1960s post-industrial development that planners hoped would help transform the city (and the country). The exhibition site is also within sight of the elevated section of the Mancunian Way, another potent example of the 1960s agenda for radical urban transformation of the city through large-scale transport infrastructure.

Some more detail on the free exhibition is given on the Manchester Modernist Society events page. At the heart of the exhibition are a set of interactive models of unrealised 1960s era redevelopment schemes for five different sites created by the student teams (supported by Kevin Tan). These are presented in computer game environment that visitors can explore. In addition to these 3d digital models, the exhibition includes a series of large visual panels explaining the five redevelopment sites and the various possible architectural solutions that were advanced but unrealised. There is also a nice physical architectural model of planned Manchester Polytechnic development and a cabinet displaying some of the original planning reports and brochures from the 1960s. To accompany the exhibition there is a free 60-page print catalogue full of architectural pictures and historical plans. 

https://twitter.com/modernistsoc/status/739021808939241472

The production of the exhibition has been generously supported by architectural firms BDP and Hawkins\Brown. In particular, we are grateful to Bruntwood who have let us have the space in the Manchester Technology Centre for three weeks as well as funding support.

 ---------

Exhibition location: Oxford House, Manchester Technology Centre, Oxford Road, Manchester, M1 7ED.

General admission: June 6th - 24th, 9am to 6pm Monday to Friday (and Saturday 11th June).

Monday, May 30, 2016

Verticality and Urban_Mobility presentation 

Verticality and Urban Mobility

I was pleased to be able to participant in 'Above. Degrees of Elevation' an international workshop at the University of Edinburgh on the 12th May 2016. It was a stimulating meeting and really well conceived intellectually by the organisers Susanne Schregel, Nina Engelhardt and Nicoletta Asciuto. I learnt a lot, particularly in regards to representations of the 'vertical' in different humanities and English literature contexts.

I gave a historically focused, highly illustrated, presentation enitled "Verticality and urban mobility: Learning lessons from past visions of elevated transport systems in the post-war city". The abstract is below and you can browse the slides if you're interested.

Verticality and Urban Mobility presentation slides
Abstract for Above, Degrees of Elevation Workshop:
The space above crowded city streets has long been alluring to planners as a solution to the problem of urban mobility. In the post-war decades in particular there were many visions propagated for a revolution in transport exploiting verticality to separate out modes of lateral movement. Schemes were proposed for elevated highways carving through city centres, futuristic monorails running overhead and pedestrian decks connecting buildings, along with prospects of helicopters hopping between rooftop landing pads. Using empirical examples from Manchester this talk will consider the potential of some of transport plans, both built and unbuilt, and what lessons might be learnt from their failure to transform urban mobility. What might the modes of failure reveal, in deeper sense, about the possibilities and problems of vertical urbanism in terms of (1) freedom and disconnection, (2) hierarchy and inequality, (3) representation and spectatorship, (4) cost, risks, and environmental externalities?

Friday, October 02, 2015


Mapping, 4 volume edited collection of key articles in cartography

The other year I was invited by Routledge to edit a substantial, multi-volume, book in their 'Critical Concepts in Geography' series. These basically collate and republish in full a large number of the key papers and book chapters on a given topic. I've edited one of these on 'Mapping' and it has just appeared in print.

The 4 volumes contain 76 separate pieces from the 1908 Max Eckert article ‘On the Nature of Maps and Map Logic’ to an 2013 article, ‘The London Underground Diagram: Between Palimpsest and Canon’, by Samuel Merrill. The 4 volumes are structured by theme as follows:
  • Volume I: Mapping definitions and paradigms
  • Volume II: Map design and communication
  • Volume III: Mapping technologies and techniques
  • Volume IV: People and politics
The volumes when combined this runs to just over 1600 pages over 200 black and white illustrations. As you might expect the set is not cheap; a snip at £900! The production values are pretty good but I thought it was shame they could not have come up with a nice cover design.

I'm not quite clear what the business model is for this kind product. Routledge have invested a lot of up front capital in securing permissions to reprint so much work and in terms of reformatting and copyediting. But I guess they are fairly certain of a large library market that will buying up copies!

Thursday, August 13, 2015

Tunnels Through Time - Manchester's unreaslised underground railway

A bit of press coverage for research into unrealised tunnels under Manchester that have been proposed to try to 'solve' the city's transport problems. Many schemes have come and gone down the years but none have been built. The 'tunnels through time' schematic was created to try to summarise some of the more important proposals and the different routing possibilities for serving the existing train stations and connecting across the city centre.
The graphic was put together by our cartographer Graham Bowden from original historical sources I pull together in old newspapers and obscure transport reports. (There is a large, high-resolution version available as a jpeg image or pdf; it can also be browsed online as a issuu document.)

Following a well crafted press release by Deborah Linton, the Manchester Evening News ran the story on 11 August: Revealed: 100 years of failed transport plans for Manchester – monorail and underground tube included.

More background detail is given in the chapter on the 1970s Picc-Vic rail tunnel in our Infra_MANC exhibition catalogue.

Tuesday, July 21, 2015

Cold War Urbanism


I co-organised, with Richard Brook, a double session of papers at the 16th International Conference of Historical Geographers in London at the start of this month. Our session ran on the Thursday 9th July and had six really interesting papers from a range of international speakers looking at themes around strategic plans, secure structures and technocratic politics in the Cold War. I also did an introductory talk and Richard was down to be the discussant at the end. List of speakers and their paper titles is given below.

Session abstract:
In this session we wish to explore how the threat of nuclear war in the 1950s and ‘60s affected planning at a range of geographic scales. National and international telecommunications networks were built during this time as a direct response to global political conditions. The rise of atomic power and computational technologies required new facilities that were often dispersed and situated variously for secrecy and locally available expertise/experience. The zoning of land and organisation of facilities and the planning towns is not conventionally viewed as informed by processes of the ‘warfare state’ (Edgerton, 2005), but we want to ask; What were the patterns of the built environment, economic structures and aesthetics / cultures of Cold War urbanism in Britain? As Boyd and Linehan (2013) state in the introduction to their recent book Ordnance: War +Architecture & Space, we need to be alert to ‘escalation in the intersections between the fabric of the landscape and the technologies of war and the extrusion and mutation of war from the battlefield into everyday life’. The papers draw on a range of different evidential bases, archival research, personal histories and lived experiences and theoretical ideas to understand the spatiality of technological development, primarily focused upon city scales and architectural resultants.

  1. Cold war urbanism: the challenge of survivable city infrastructures; Martin Dodge (University of Manchester, UK)
  2.  Promise and threat: The dawn of the atomic age and the architectural imaginary; Russell Rodrigo (University of New South Wales, Australia)
  3. The iconography of the nuclear war threat in Cold War Bologna; Eloisa Betti (University of Bologna, Italy)
  4. Airspace in the nuclear age; Jonathan Hogg (University of Liverpool, UK)

  1. The Warsaw Metro and the Warsaw Pact: from deep tunnels to cut and cover; Alex Lawrey (Independent Scholar / Town Planner)
  2. Forming an everyday Cold War network: The constitutive role of law, surveying and asset management in the birth, life and death of Royal Observer Corps; Luke Bennett and Sarah Cardwell (Sheffield Hallam University, UK)
  3. The anticipatory space of the bunker, modernity’s dark mirror; Gary A. Boyd (Queen’s University Belfast, UK) and Denis Linehan (University College Cork, Ireland)

Monday, June 01, 2015

Spaces of Infrastructure: The History and Description of the Manchester Waterworks

A good exemplar of infrastructural geography can be seen in the major Victorian engineering efforts to secure clean drinking water for the people of Manchester. This involved developing a large-scale system of reservoirs along the valley of the Etherow River to gather and store the plentiful rain water falling on the Peak District hills. Known as the Longdendale supply system, it became fully operational in 1877 and was able to deliver over 17 million gallons of clean drinking water per day to the city through a ten mile long aqueduct using only the force of gravity. It was widely celebrated at the time as a truely pioneering piece of engineering and one that brought real public health benefits to the residents of Manchester.

The complexity of the waterworks infrastructure is well summarised 
in this 1881 diagram. (Image courtesy of Manchester City Archives.)

A detailed narration of the Longdendale project, which commenced in 1846 and took several decades to complete, was provided in a book length treatise, the History and Description of the Manchester Waterworks, written by the lead engineer responsible for its design and execution, John Frederick Bateman. His book was published in 1884 and it was a weighty tone packed with factual details and accompanied by over fifty plates. 

The whole book, including all the maps and plans has now been digitised through the expertise of the Centre for Heritage Imaging and Collection Care in the University of Manchester Library and is freely available to browse online. (If you want to own a print copy of Bateman's original book, they are available on the secondhand market but they're not cheap to buy.) While the book is somewhat autobiography, and unsurprisingly tends to privilege Bateman's role in the work, it does seem in many respects to be reliable account of the emergence of this infrastructural system.

http://luna.manchester.ac.uk/luna/servlet/s/41tp2h 
Browse the full version of the

Storing Water Safely
Engineering reservoirs is, at its most fundamental, all about the construction of the core of the dam to hold back the pressure of millions of tons of water. One of the hardest engineering challenges Bateman faced in building the Longdendale reservoir chain was the significant problems he encountered in making the Woodhead dam secure and watertight, in part because of the unstable ground conditions around the chosen embankment site. Some of this detail is captured in this diagram from the book, the 'longitudinal section of puddle trench for the second embankment shewing the geological strata'. (You can examine a high resolution version of this diagram here.)

 "Longitudinal section of puddle trench for the second embankment shewing the geological strata", from the History and Description of the Manchester Waterworks.


Bateman recounted the challenge of the Woodhead dam as follows:

"The puddle trench of this embankment was an expensive and troublesome work. The borings, which were taken before the work was commenced, were, as has been stated, very deceptive. They indicated the existence of rock at a depth of about 20 feet below the surface of the ground on the Derbyshire or south side of the valley, and though it was well known that here there was an ancient landslip - the rock which was. supposed to exist was also supposed to be the original ground on which the slip had taken place. Instead, however, of rock being found at this depth large loose stones or blocks of rock were found, sometimes resting on each other; and though the material in which they were imbedded was generally stiff retentive clay, there were beds or "pot-holes" of sand or gravel which it was deemed prudent to follow or cut out. It was, therefore, necessary to go to a much greater depth and distance into the hill than was anticipated."  (p.121)

Seeing the Infrastructural System
The History and Description of the Manchester Waterworks runs to 224 pages and has over 50 large and well crafted illustrations including a range of overview maps, detailed engineering schematics, cross sectional diagrams and statistical charts. One of my favourite illustrations is this finely proportioned fold-out map that delineates the sizes and sinuous shapes of the five main reservoirs along the chain, from running in sequence from Bottoms upto Woodhead, plus the smaller reservoirs in side valleys and the various anciliary facilities, connections and conduits.

"Plan shewing storage reservoirs in the valley of Longdendale", from the History and Description of the Manchester Waterworks

Following on from the development of the supply system in the Longdendale valley, the growing demand from city and surrounding towns meant Manchester's infrastructural imperatives looked even further north in the 1870s to the abundant water available in the Lake District. Manchester next water supply scheme was to tranform the Thirlmere Lake into a huge storage reservoir and to build a 96 mile long gravity feed aqueduct.

Some further reading:

Sunday, June 29, 2014

1923 Manchester Ship Canal strip mapStrip Maps of the Manchester Ship Canal

I am a big fan of unusual modes of mapping. One cartographic design approach that has long fascinated me is the linear route chart, known as the 'strip map'. A few years ago for my PhD research I wrote a draft chapter considering how the process of data routing through the Internet could be represented using the strip map concept, and also thought of as a kind of 'Songline'. (Somewhat sadly, this work did not make into the finished thesis as it was not deemed worthy by my PhD examiners!)

Anyway, the cartographic scholar Alan MacEachren has also written some key articles describing the nature and utility of strip maps a couple of decades ago. In particular, he usefully delineated the essential characteristics of strip maps in his 1986 article, setting out a five-level schema of ‘stripness’:
  1.  linear form omitting geographic detail beyond a narrow route corridor,
  2. orientation with a direction other than north at the top, not orientated along a cardinal direction, 
  3. lack of concern with geographic orientation; no indication of cardinal directions given,
  4. relaxation of planimetric accuracy to allow variations in scale and orientation between different parts of the map so as to maintain the linear format of the route,
  5. strict linear representation of route way with complete disregard to consistent scale or direction.
    The strip map can be a very effective means of representing long complex routes in a clear fashion by eliminating a lot of extraneous detail. Despite its utility it is not a widely seen mode of mapping but examples can be found throughout cartographic history, including some ancient Roman examples and well known pilgrimage charts from the medieval period. The strip map came into its own with the development of better transportation from the eighteenth century onwards in terms of displaying turnpike roads, canals and railway lines. The different contexts in which the strip map has been deployed are well documented in another paper by MacEachren and his Johnson.

    Interestingly multiple versions of strip maps were also published through the twentieth century by the owners of the Manchester Ship Canal to promote its facilities. The linear nature of the 36 mile long canal made it well suited to being displayed in abstract form that eliminates much geographical reality for sake of clarity. The first example map, shown above, is from 1923 and represents the Ship Canal as a dead straight orange line from the Mersey down to Manchester Docks. All the locks and different bridge crossings are neatly delineated, along with small icons locating important canal side industrial facilities, such as Robertson's Steel Works at Thelwell. (The location of Lymm golf course is also shown for some reason.) Wider loops of the older Bridgewater Canal the River Mersey that accompany the MSC are also depicted.

    The second example, shown on the right, is a somewhat more simplified in informational content and also slightly less 'strip' straight, with the cartographer choosing to represent at least some of the sinuosity of the canal's real geography. The result is rather cartoon like, in keeping with its role as the key illustration in a tourist leaflet to guide people taking an 'educational cruise' down the Manchester Ship Canal in the mid 1960s. (This image is scanned from an original copy of the leaflet in the Brian Robinson Archive, courtesy of Lloyd Robinson.)

    Manchester Ship Canal strip map, 1970s?
    On the left is more contemporary version, described as a 'diagrammatic map', which is packed with textual description parallel to the artificially straightened blue Manchester Ship Canal channel. (Indeed, the map component seems rather constrained by the more verbose text, making it less aesthetically pleasing chart than earlier examples.) Again the multiple crossings and locks along the MSC's full length are carefully denoted from Eastham locks on the Mersey Estuary downwards. Compared to earlier examples, the Queen Elizabeth II oil dock at top of Canal, newly built in 1954, provides a somewhat odd looking addition. There is little coverage of the Bridgewater Canal on this strip map, reflecting its diminished status as a transport route by the post-war period.
    If you want to see these three example charts in more detail, I have put them together into single pdf: Manchester Ship Canal strip maps.

    Further reading: